Analysing Executive Records data for 4747 IAS officers
2016-02-10
Introduction
A couple of months back I'd written a python script to extract the Executive Record Sheet data, containing official information on all IAS officers in the service. I'd meant to do a short analysis of that dataset but never actually got around to it until recently.
The main reason for procrastination was the fact that the data required a significant effort to munge. I'd started coding up a parsing script but took my time finishing it. The script itself was quite unpythonic in some ways but the result was a nicely formatted JSON dataset that could also be imported to pandas (python library for data analysis).
Data
The final dataset contained all information in the 'Bio Data', 'Educational Qualification', 'Domestic Training', 'Foreign Training' and 'Work Experience' sections of the Executive Record Sheets of 4747 officers. This data was imported as a dataframe and several additional columns were derived from the original ones. The derived columns were:
NOTE:
- 1. The Total Profiles have been calculated only for those officers who have at least 2 assignments in their Work Experience so as to filter out officers still in the training period.
- 2. Years in Service have been calculated with 2014 as the reference year.
- 3. Transfer Ratio has been calculated only for those officers who have been in the service for 3 or more years.
Analysis
After splitting the details on birth day, month and year I did a count to see which birth days and birth months
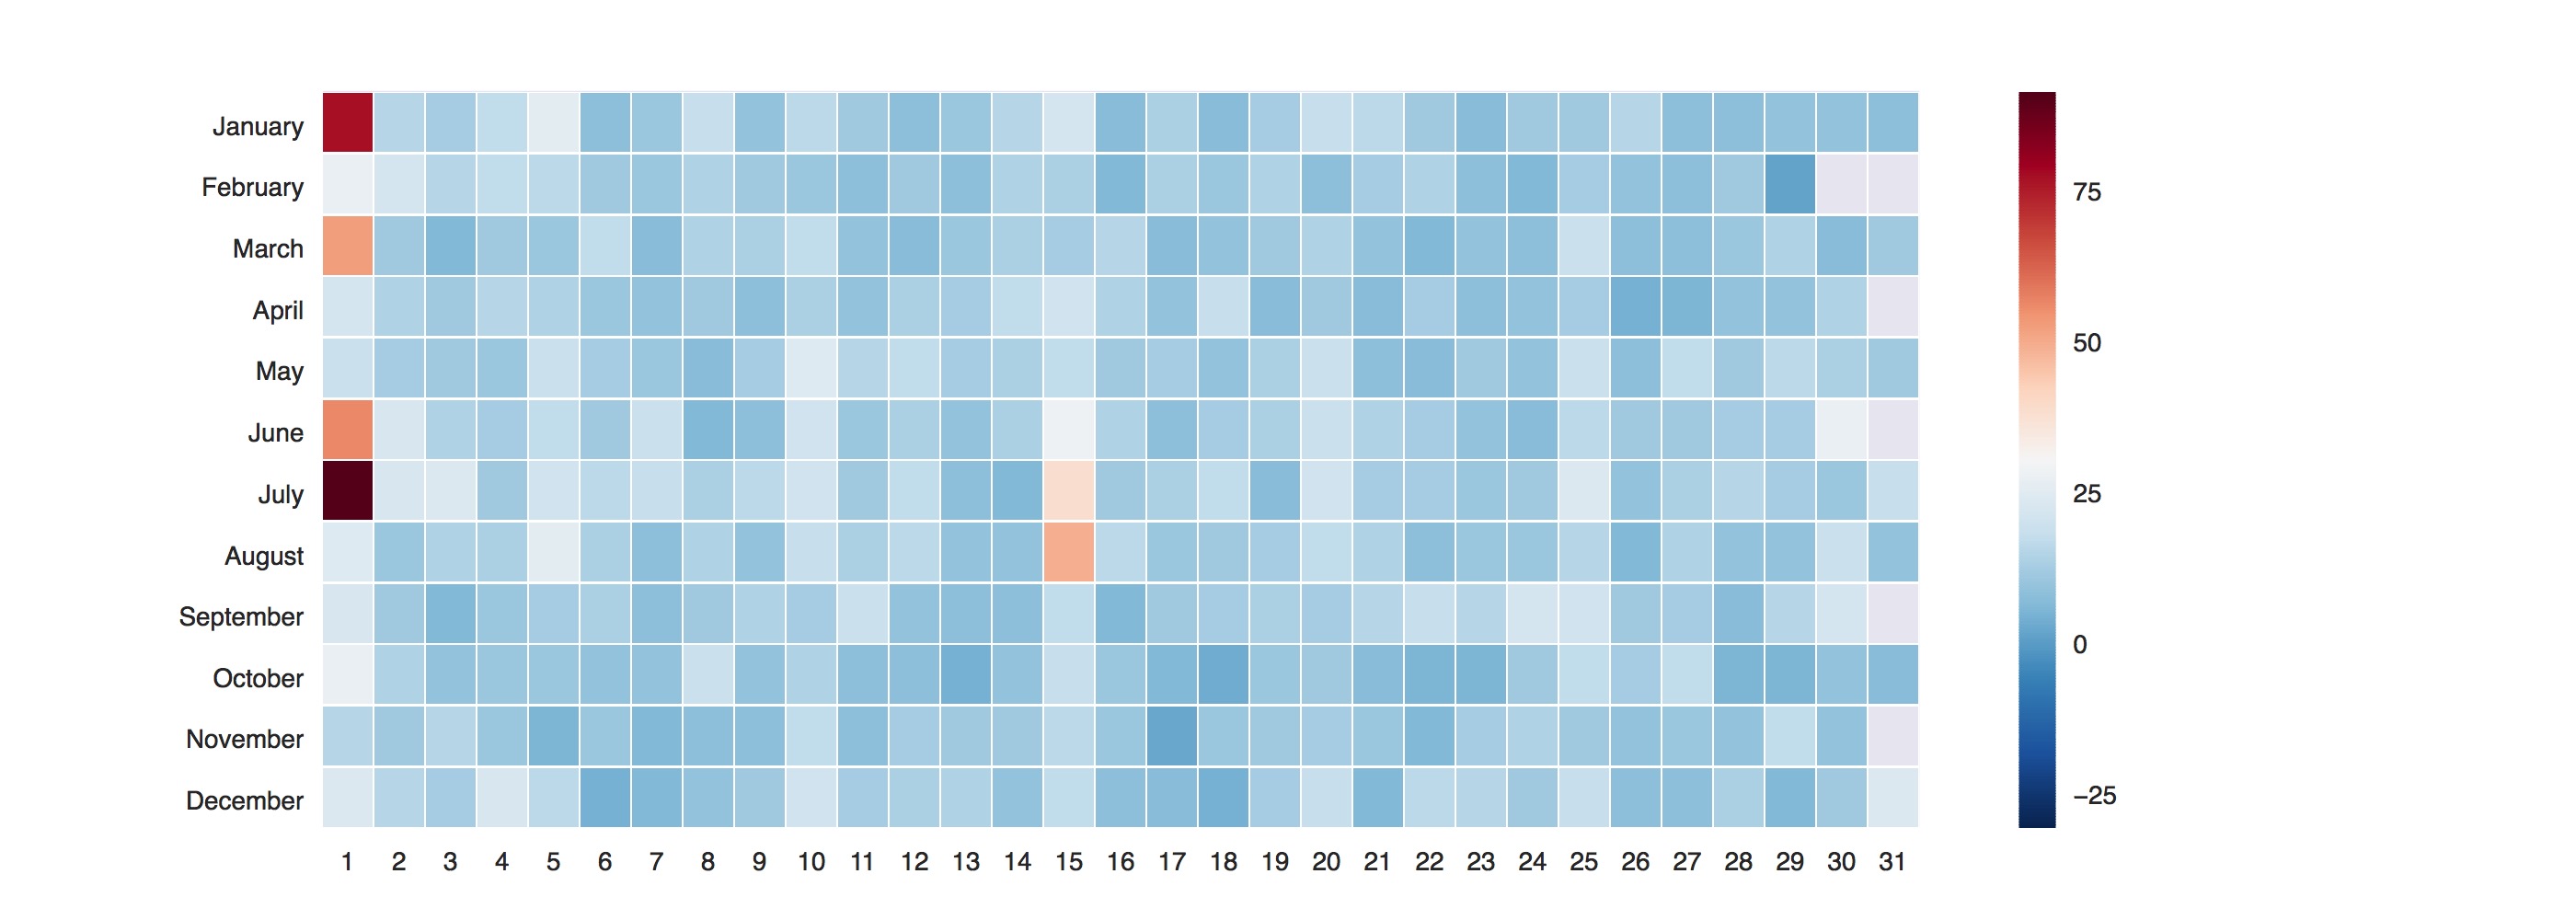
were the most common. Turns out, the maximum number of officers were born on the 1st of any given month (a total of 454), with
dates that are multiples of 5 occupying the top 5 places. 1st of July and 1st of January seem to be the most promising dates
to be born on if someone wants to become an IAS officer!
The heatmap below shows the Month/Day distribution of the DOBs of officers, with warmer shaded cells implying
a high concentration of births on that particular date and cooler shaded cells implying a lower one.

Next, let's plot the frequencies of the 'Age of Recruitment' of officers to see the distribution of the ages at which officers have joined the service. In the figure below, there are 2 distinct peaks of the frequency distribution: mid-20's and early 40's.

Analysing the recruitment ages at the Cadre level, we see that Rajasthan, Uttar Pradesh and Bihar cadre have the lowest median recruitment age of all the cadres.
| Median | Mean | Std Dev | Count | |
|---|---|---|---|---|
| Cadre | ||||
| Rajasthan | 25 | 26.6 | 4.6 | 175 |
| Uttar Pradesh | 26 | 28.7 | 6.6 | 405 |
| Bihar | 26 | 27.0 | 3.9 | 188 |
| Sikkim | 26 | 27.3 | 5.2 | 31 |
| Haryana | 26 | 28.8 | 6.4 | 151 |
| Orissa | 26 | 28.2 | 6.1 | 158 |
| A G M U T | 27 | 30.4 | 7.5 | 249 |
| Telangana | 27 | 30.0 | 6.4 | 118 |
| Tamil Nadu | 27 | 29.2 | 6.4 | 248 |
| Punjab | 27 | 30.4 | 7.5 | 174 |
| Nagaland | 27 | 28.2 | 4.2 | 42 |
| Manipur | 27 | 31.1 | 8.3 | 83 |
| Maharashtra | 27 | 29.4 | 6.5 | 270 |
| Madhya Pradesh | 27 | 30.4 | 7.2 | 324 |
| Kerala | 27 | 29.7 | 7.1 | 154 |
| Karnataka | 27 | 29.6 | 7.3 | 204 |
| Jharkhand | 27 | 31.5 | 8.3 | 144 |
| Himachal Pradesh | 27 | 30.5 | 8.1 | 108 |
| Gujarat | 27 | 30.8 | 8.4 | 207 |
| Assam Meghalaya | 27 | 28.6 | 6.0 | 176 |
| Andhra Pradesh | 27 | 29.4 | 6.6 | 160 |
| Uttaranchal | 27 | 30.0 | 6.7 | 84 |
| West Bengal | 27 | 30.5 | 7.5 | 225 |
| Jammu & Kashmir | 28 | 32.6 | 8.6 | 100 |
| Chhatisgarh | 28 | 30.5 | 6.8 | 135 |
| Tripura | 28 | 32.3 | 8.4 | 68 |
IAS officers, by the nature of their jobs are generalists who are required to oversee a variety of
departments and institutions over the course of their careers. For officers to be effective at any
assignment, they need to be given sufficient time to become comfortable in the working environment and role.
Frequent changes in the leadership of any department can only lead to instability in the entire department.
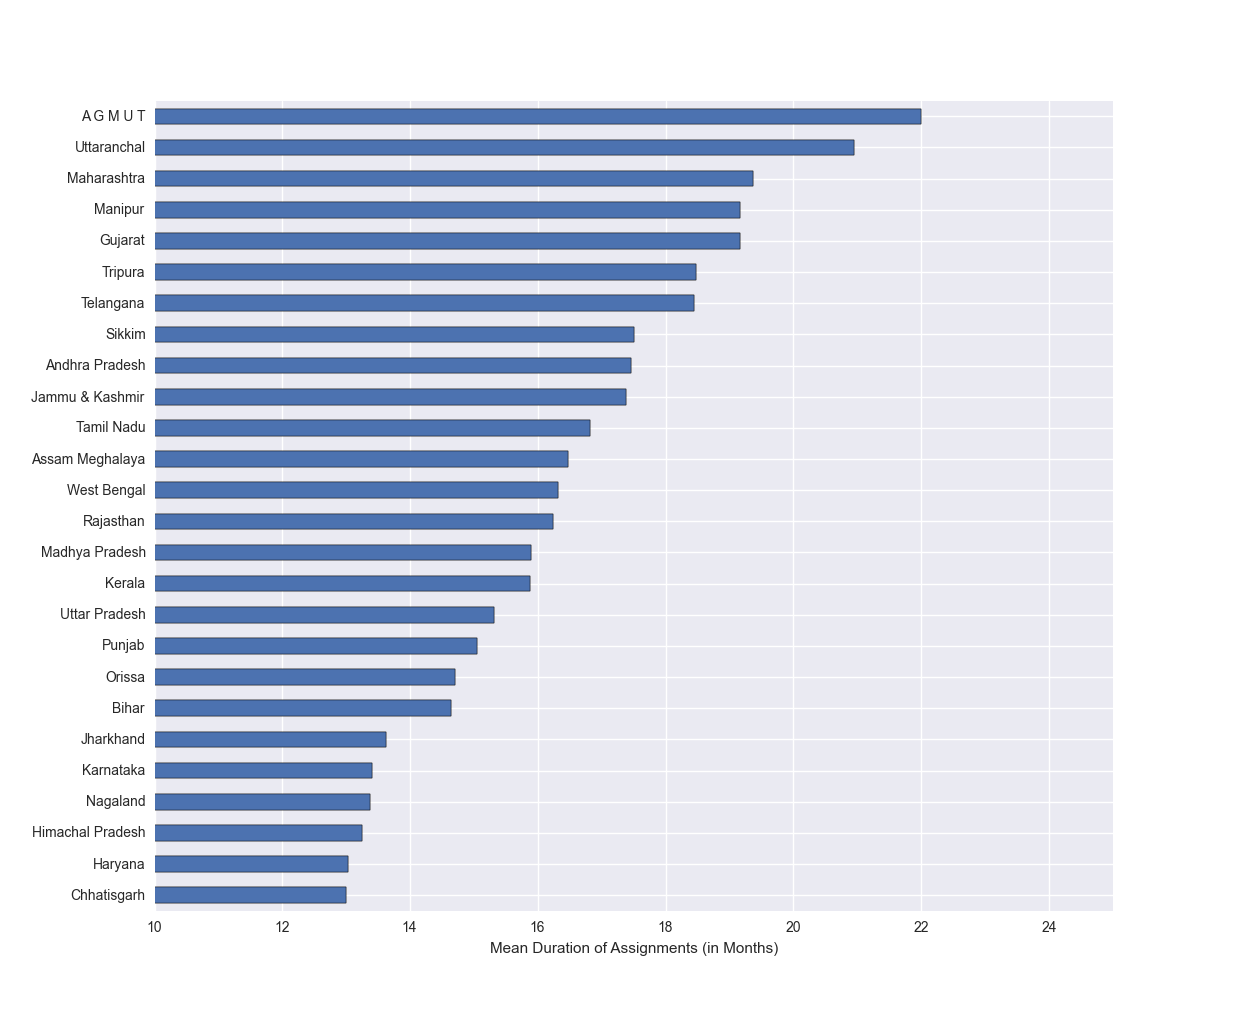
As such, an analysis of the duration of assignments of IAS officers becomes pertinent. The graph below shows the
mean duration (in months) of all the assignments IAS officers have undertaken in their respective cadres.
This was derived by taking the average duration of assignments for each individual officer in days, then averaging those
durations for every cadre.
As the graph shows, IAS officers in Chattisgarh and Haryana have the lowest average assignment durations, with an officer in these cadres spending only 13 months on an assignment. Himachal Pradesh, Nagaland and Karnataka take up the subsequent spots on the list with average durations of 13.2, 13.4 and 13.4 months respectively.

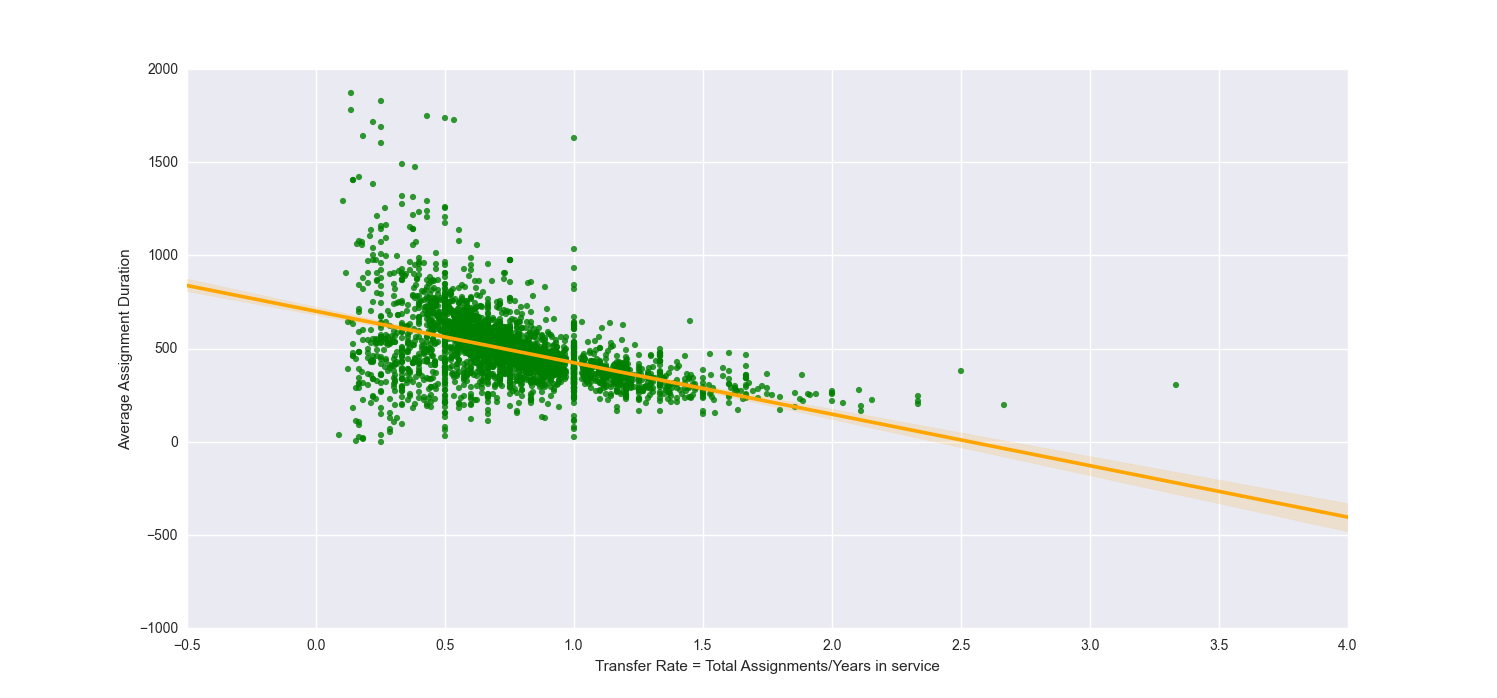
I further derived the 'Transfer Rate' of officers by dividing the total number of assignments an officer has undertaken by the total years spent in the service. This ratio was derived only for officers who have been in the service for more than 2 years to filter out officers still in their training period. As might be expected, the Transfer Ratio is inversely related to the Average Assignment Duration.

Here is a list of the 15 officers with the highest transfer rates. Dr. Ashok Khemka, who has been in the news in recent times, holds the 11th position on this list with a transfer rate of 2.0 and the longest service period.
| ID_No | Name | Cadre | Allotment_Year | Gender | DOB | Avg_Profile_Duration | Total_Profiles | Years_In_Service | Transfer_Rate |
|---|---|---|---|---|---|---|---|---|---|
| 01UL067201 | Shri Nitesh Kumar Jha | Uttaranchal | 2002 | MALE | 22/04/1977 | 304 | 40 | 12 | 3.3 |
| 01CG110E06 | Shri Sanjeev Kumar Jha | Chhatisgarh | 2011 | MALE | 04/01/1976 | 200 | 8 | 3 | 2.7 |
| 01UL067202 | Ms. Radhika Jha | Uttaranchal | 2002 | FEMALE | 09/12/1976 | 378 | 30 | 12 | 2.5 |
| 01CG110E03 | Shri Chandan Kumar | Chhatisgarh | 2011 | MALE | 17/01/1985 | 219 | 7 | 3 | 2.3 |
| 01CG110E02 | Shri Deepak Soni | Chhatisgarh | 2011 | MALE | 01/01/1985 | 244 | 7 | 3 | 2.3 |
| 01HY023000 | Shri Satyaprakash T L | Haryana | 2002 | MALE | 21/03/1976 | 203 | 28 | 12 | 2.3 |
| 01CG047200 | Smt. Shahla Nigar | Chhatisgarh | 2001 | FEMALE | 31/03/1973 | 222 | 28 | 13 | 2.2 |
| 01BH050300 | Shri Divesh Sehara | Bihar | 2005 | MALE | 07/01/1979 | 191 | 19 | 9 | 2.1 |
| 01UP065100 | Shri M Devaraj | Uttar Pradesh | 1996 | MALE | 27/05/1970 | 163 | 38 | 18 | 2.1 |
| 01AM025200 | Dr. M Ariz Ahammed | Assam Meghalaya | 1995 | MALE | 12/08/1968 | 277 | 40 | 19 | 2.1 |
| 01HY020600 | Dr. Ashok Khemka | Haryana | 1991 | MALE | 30/04/1965 | 210 | 47 | 23 | 2.0 |
| 01UP108X04 | Shri Vaibhav Shrivastava | Uttar Pradesh | 2009 | MALE | 01/07/1981 | 262 | 10 | 5 | 2.0 |
| 01MP110M06 | Smt. Neha Marvya Singh | Madhya Pradesh | 2011 | FEMALE | 22/08/1986 | 217 | 6 | 3 | 2.0 |
| 01HP110H01 | Shri Lalit Jain | Himachal Pradesh | 2011 | MALE | 19/03/1983 | 270 | 6 | 3 | 2.0 |
| 01CG110E04 | Shri Bhoskar Vilas Sandeepan | Chhatisgarh | 2011 | MALE | 01/06/1978 | 256 | 6 | 3 | 2.0 |